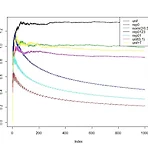
Traing NN with h2o Traing NN with h2o h2o package로 XOR 훈련시키기 입력 및 출력 자료 input = matrix(c(0,0,1,1,0,1,0,1), ncol=2) output = matrix(c(0,1,1,0), ncol=1) data = cbind(input,output) h2o 불러들이기 library(h2o) ## Warning: package 'h2o' was built under R version 3.0.3 ## Loading required package: RCurl ## Loading required package: bitops ## Loading required package: rjson ## Loading required package: stat..
Training Neural Net using deepnet Training Neural Net using deepnet 뉴럴 넷 학습시키기 유명한 XOR input = matrix(c(0,0,1,1,0,1,0,1), ncol=2) output = matrix(c(0,1,1,0), ncol=1) deepnet으로 학습시키기 library(deepnet) ## Warning: package 'deepnet' was built under R version 3.1.2 nn
 a CRF model for denoising
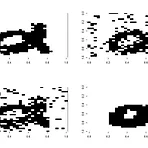
R의 package CRF를 활용하여,Bishop(2006, pp.387-389)에 소개된 denoising MRF를 구현해 보았다.다소 큰 이미지는 adjacency matrix를 만들기에 메모리가 부족하기에,작은 이미지 화일로 실험을 해 보았다. node potential 결정하는 게 어려워서 그냥 0으로 했다.edge potential를 포함해서 parameter를 적절히 정하는 법을 생각해봐야 할 듯 하다. 근데 train은 왜 안 되지? 결과. 왼쪽 위 : 원본, 왼쪽 아래 : 10% noise, 오른쪽 위 : icm으로 보정, 오른쪽 아래 : lbp로 보정 source : crf_denoising.R, image1 : alpha.jpg, image2 : R.jpg pr.noise= # nois..
 R source for lempel-ziv complexity
Reading Aboy et al.(2006), I needed a function for computing lempel-ziv complexity.I searched throughout the internet, but I couldn't find one.So, I had to program one myself.Here are the source, an example and the result. # FUNCTION lempel.ziv(____.VEC, ____.VEC)# s is a sequence vector# alphabet is a vector of alphabet letters# function counts unique sub-sequence and normalized it# ref) Aboy e..
R studio : IDE(Integrated Developing Environmet?) for R : https://www.rstudio.com/Git : Version Control Program : http://git-scm.com/BitBucket : https://bitbucket.org/dashboard/overview 서로 다른 컴퓨터로 코드를 작성함에 따른 불편함을 해결하는 방법은1. Dropbox와 같은 파일 동기화 프로그램을 이용한다.2. Git과 같은 Version control 프로그램을 이용한다. R의 경우 R studio에서 손쉽게 클릭 몇 번으로 Version control program을 활용할 수 있다. 이 때 Server로 GitHub와 BitBucket을 쓸 수 있는데,..
frequency polygons frequency polygons As i surfed around the web, I came across this lecture Statistics 202: Statistical Aspects of Data Mining, Summer 2007 The Lecture The Web It drew my attention and I watched the first video and the whole slides from the web. It wasn't so hard. Anyway, the Lecturer introduces frequnecy polygon, which looks cool. So I implemented it as a function, freqPolygon...
R Python search() ls() ls(pos=2) dir(__builtins__) help(abs) ?abs help(abs) 5 %% 2 7 %% 3 5 % 2 7 % 3 increment=function(x) { x+1 } def increment(x): return x+1 sent = "I'm feeling good." sent = "I\'m feeling good." sent = 'I\'m feeling good.‘ sent = "I\'m feeling good." sent = "I'm feeling good." sent = 'I\'m feeling good." print(paste(c("ba",rep("na",2), "muffin."), collapse="")) print("ba"+"n..
#01 search() ls() ls(pos=2) #02 help(abs) ?abs #03 5 %% 2 7 %% 3 #04 increment=function(x) { x+1 } #05 sent = "I'm feeling good." sent = "I\'m feeling good." sent = 'I\'m feeling good.' #06 print(paste(c("ba",rep("na",2),"muffin."), collapse="")) #07 age=readline("How old are you?") #cat("How old are you?"); age=scan(what=numeric(), nmax=1) #08 comp=function(n) { ifelse(n>100, "More than 100.", ..
#01 dir(__builtins__) #02 help(abs) #03 5 % 2 7 % 3 #04 def increment(x): return x+1 #05 sent = "I\'m feeling good." sent = "I'm feeling good." sent = 'I\'m feeling good." #06 print("ba"+"na"*2+"muffin.") #07 age=input("How old are you?") #08 def comp(n): if n>100: return "More than 100." elif n>10: return "More than 10, but equal to or less than 100." else: return "Equal to or less than 10." #0..
